
Bull & Bear Flags: The Ultimate Guide to Spotting and Trading Them in Crypto

Learn how to spot and trade bull and bear flags in crypto markets like a pro. Discover real-world examples, step-by-step guides, and expert trading strategies to maximize profits while managing risks.
Is Your Trade About to Fly or Fall? Here’s How to Tell
Have you ever placed a trade, thinking the market was heading one way, only to watch it reverse against you? If so, you’re not alone. Many traders struggle to identify whether a trend will continue or break down.
Enter bull and bear flags, two of the most powerful continuation patterns in technical analysis. When correctly spotted, they can help traders predict the next big move and enter trades with confidence.
In this guide, we’ll break down:
What bull and bear flags are and how to spot them
Key differences between the two patterns
Step-by-step guides on how to trade them effectively
Real-world examples of flag patterns in action
Pro tips to avoid common trading mistakes
By the end, you’ll have a solid strategy for incorporating flag patterns into your crypto trading playbook.
Let’s get in!
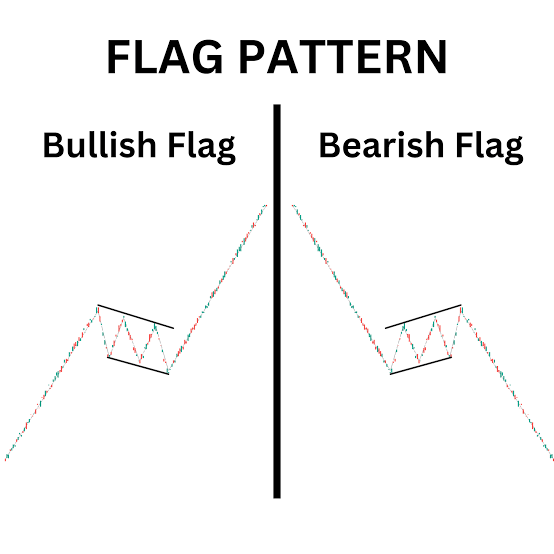
What Are Bull and Bear Flags?
Bull and bear flags are continuation patterns that appear when a strong price move is followed by a period of consolidation before the trend resumes.
Bull Flag (Bullish Continuation)
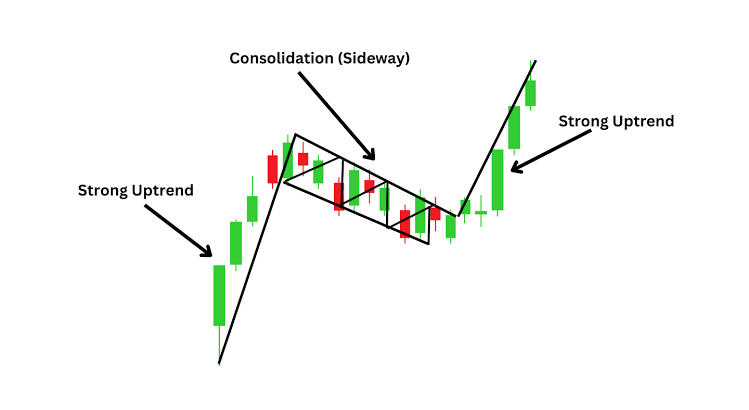
A bull flag forms when:
• Price rises sharply (forming the flagpole)
• A brief consolidation follows, with price moving in a downward-sloping channel
• A breakout occurs, pushing the price higher
Example:
In 2021, Bitcoin formed a classic bull flag after rallying from $30,000 to $50,000. The price then pulled back slightly before breaking out to new highs above $60,000.
Key Characteristics of a Bull Flag:
Forms in an uptrend
Consolidation occurs in a downward-sloping channel
Breakout happens above the resistance line
Volume surges on breakout
Bear Flag (Bearish Continuation)
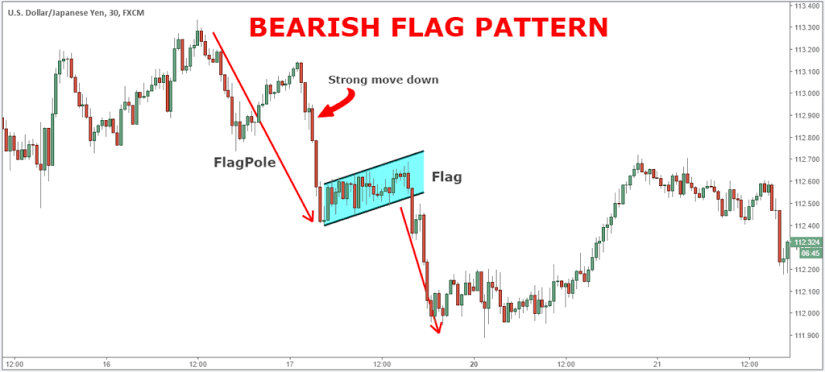
A bear flag is the opposite of a bull flag. It forms when:
• Price drops sharply (forming the flagpole)
• A brief consolidation follows, with price moving in an upward-sloping channel
• A breakdown occurs, pushing the price lower
Example:
In June 2022, Ethereum dropped from $3,500 to $1,500 and formed a bear flag. After a brief consolidation, ETH broke below the support level and fell further to $1,000.
Key Characteristics of a Bear Flag:
Forms in a downtrend
Consolidation occurs in an upward-sloping channel
Breakdown happens below the support line
Volume surges on breakdown
Bull Flags vs. Bear Flags: Key Differences
Parameter: Market Trend
Bull Flag: Forms in an uptrend
Bear Flag: Forms in a downtrend
Parameter: Price Movement
Bull Flag: Strong upward move → consolidation
Bear Flag: Strong downward move → consolidation
Parameter: Breakout Direction
Bull Flag: Upward (breaks resistance)
Bear Flag: Downward (breaks support)
Parameter: Entry Point
Bull Flag: When price breaks above the flag boundary
Bear Flag: When price breaks below the flag boundary
Parameter: Target Price
Bull Flag: Flagpole height added to breakout
Bear Flag: Flagpole height subtracted from breakout
Parameter: Stop-Loss Placement
Bull Flag: Below the flag’s lower boundary
Bear Flag: Above the flag’s upper boundary
Parameter: Volume & Sentiment
Bull Flag: Surge in volume confirms breakout
Bear Flag: Surge in volume confirms breakdown
How to Trade Bull Flags: A Step-by-Step Guide
1. Identify the Bull Flag
• Look for a strong upward price movement (flagpole).
• Spot a downward-sloping consolidation phase.
• Ensure volume decreases during consolidation.
2. Set Your Entry Point
• Enter when the price breaks above resistance with high volume.
3. Determine Your Profit Target
• Measure the height of the flagpole and add it to the breakout level.
4. Place a Stop-Loss
• Below the flag’s lower boundary (to protect against false breakouts).
Real-Life Example:
In October 2021, Solana (SOL) formed a bull flag after rallying from $120 to $180. It then consolidated around $160 before breaking out and surging to $260.
How to Trade Bear Flags: A Step-by-Step Guide
1. Identify the Bear Flag
• Look for a sharp downward price movement (flagpole).
• Spot an upward-sloping consolidation phase.
• Ensure volume decreases during consolidation.
2. Set Your Entry Point
• Enter when the price breaks below support with high volume.
3. Determine Your Profit Target
• Measure the height of the flagpole and subtract it from the breakdown level.
4. Place a Stop-Loss
• Above the flag’s upper boundary (to protect against false breakdowns).
Real-Life Example:
In May 2022, LUNA formed a bear flag after dropping from $80 to $40. It briefly consolidated, then broke below $35, eventually crashing to near zero.
Avoiding False Signals from Flag Patterns
1. Use Confirmation Indicators
Combine flag patterns with:
Relative Strength Index (RSI) : Avoid buying if RSI is overbought.
Moving Averages: A breakout above the 50-day MA adds confidence.
2. Wait for Volume Confirmation
If the breakout happens with low volume, it could be a false signal.
3. Set Conservative Stop-Losses
Bull Flag: Stop-loss below support
Bear Flag: Stop-loss above resistance
Key Takeaways
(Image that suggest Key takeaway)
Bull and bear flags help traders predict market trends.
Entry points are at breakout levels, confirmed by volume.
Risk management is essential; use stop-loss orders.
Real-life examples show how effective these patterns can be.
Future Outlook: Will Flag Patterns Work in 2025?
With increasing institutional adoption and AI-powered trading bots, technical patterns like flags remain relevant. However, combining them with on-chain data and macro trends will be crucial for future success.
Pro Tip: Use Binance Research to track historical patterns in the market.
Final Thoughts:
Mastering Flag Patterns for Profitable Trading
Flag patterns are powerful tools for spotting high-probability trades. Whether you’re trading Bitcoin, Ethereum, or altcoins, mastering bull and bear flags can sharpen your trading edge.
Want more trading insights?

For daily updates, follow us on all socials; Instagram, Twitter, Telegram, and TikTok. Subscribe to our newsletter for expert analysis and join our WhatsApp channel to continue the conversation.