

Ever looked at a cryptocurrency chart and wondered why thousands of people seem to understand what you’re seeing while it looks like random lines and numbers?
You’re not alone.
For many beginners, crypto market data feels overwhelming. Prices move every second, charts are filled with colorful candles, trading platforms display dozens of unfamiliar metrics, and social media is full of people making bold predictions. It’s easy to assume successful investors simply “know” where the market is going.
The reality is much different.
Successful crypto investors don’t rely on luck, they learn how to interpret market data, separate meaningful signals from noise, and make decisions based on evidence instead of emotion with just one app.

Introduction
Imagine walking into a supermarket where every price changes every second. Would you immediately buy the first product you saw?
Probably not.
You would compare prices, look at demand, notice discounts, and decide whether today’s price makes sense. Crypto markets work the same way. Every trade creates new information. Millions of buyers and sellers interact around the world 24 hours a day, seven days a week. Their decisions generate enormous amounts of data.
That data tells a story. When you learn to read it, you’ll begin seeing opportunities and risks that most beginners completely miss.
Let’s start with the basics.
What Is Crypto Market Data?
Crypto market data is the collection of information generated whenever cryptocurrencies are bought, sold, transferred, or held.
Think of it as the heartbeat of the crypto economy.
It includes:
Current prices
Historical prices
Trading volume
Market capitalization
Order book activity
Blockchain transactions
Wallet activity
Liquidity
Funding rates
Open interest (for derivatives)
Each metric answers a different question.
Why Understanding Market Data Matters
Most beginners focus on one thing:
“Is the price going up or down?”
Professional investors ask different questions.
Why is it moving?
Is demand increasing?
Is volume supporting the move?
Are large investors accumulating?
Is the trend sustainable?
Those questions reduce emotional decision-making. Instead of chasing hype, you’re following evidence.
How Crypto Prices Actually Move
Unlike traditional stock exchanges with limited trading hours, crypto trades continuously. Prices change because buyers and sellers constantly negotiate value.
What makes crypto unique is its speed. News, regulations, exchange listings, macroeconomic events, and even viral social media posts can influence prices within minutes.
Understanding Market Capitalization
One of the first metrics beginners encounter is market capitalization, often shortened to market cap.
Formula:
Market Cap = Current Price × Circulating Supply
Example:
If a cryptocurrency trades at ₦15,000 and has 10 million coins in circulation:
Market Cap = ₦150 billion
A high price doesn’t automatically mean a project is valuable.
For example:
Coin A costs ₦1,000,000 but only 500 coins exist.
Coin B costs ₦1,000 with billions of coins.
Coin B could still have a much larger market value. Always compare market caps, not just prices.
Trading Volume: The Market’s Lie Detector
Trading volume measures how much of a cryptocurrency changes hands during a given period. Think of volume as applause after a speech, a loud applause means many people agree. Silence tells a different story, the same applies to crypto.
Rising Price + High Volume
Usually indicates strong buyer confidence.
Rising Price + Low Volume
May signal weak momentum.
Falling Price + High Volume
Can indicate panic selling.
How to Read a Candlestick Chart
Candlestick charts are among the most useful tools in crypto, they summarize price movement during a specific time period.
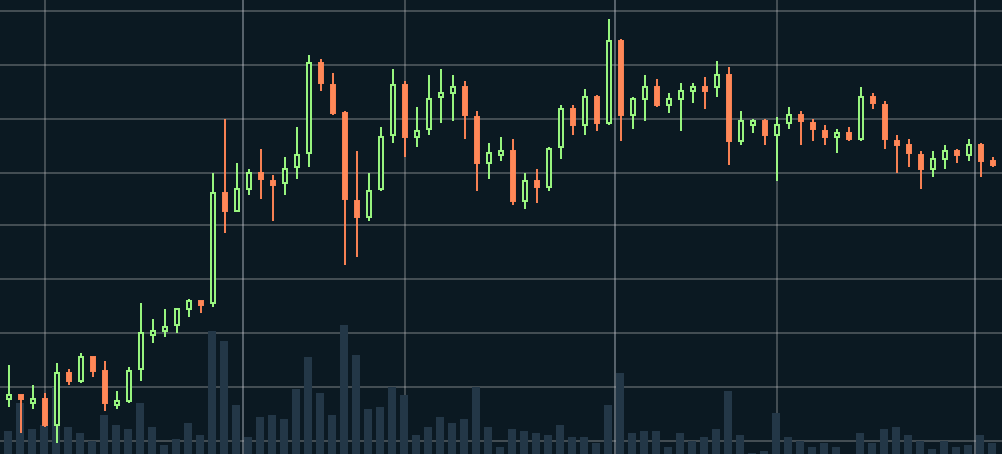
Every candle shows four values:
Open
High
Low
Close
If price closes higher than it opened: The candle is usually green, if price closes lower: The candle is usually red.
Think of each candle as a summary of a battle between buyers and sellers.
Common Candlestick Patterns Beginners Should Know
Hammer
Often appearing after declines, can signal buyers stepping back into the market.
Shooting Star
Appears after rallies, may suggest buying momentum is weakening.
Doji
Open and close prices are nearly identical.
Represents market indecision.
Important reminder:
Never trade based on one candle alone. Always combine candlestick patterns with volume and broader market trends.
Trend Analysis Made Simple
Instead of asking:
“Is Bitcoin going up today?”
Ask:
“What direction has it been moving for weeks?”
Three trends exist:
Uptrend
Downtrend
Sideways
Recognizing the broader trend helps you avoid reacting to every small price swing.
What Is an Order Book?
An order book displays pending buy and sell orders on an exchange.
It shows:
Who wants to buy
Who wants to sell
At what prices
Think of it as a waiting room for future trades, large buy orders can sometimes act as temporary support while large sell orders can create resistance.
Remember, however, that some large orders may be cancelled before execution, so order books should be interpreted with caution.
Understanding Liquidity
Liquidity measures how easily you can buy or sell an asset without significantly affecting its price.
High liquidity means:
Faster execution
Smaller price differences
Lower trading costs
Low liquidity increases risk.
Many small-cap cryptocurrencies experience dramatic price swings because relatively small trades can move the market.
On-Chain Data: Crypto’s Unique Advantage
Unlike traditional financial markets, many blockchain networks publish transaction data publicly. This creates on-chain analytics.
You can measure:
Active wallet addresses
Transaction volume
Coins moving to exchanges
Coins leaving exchanges
Large holder (“whale”) activity
Network fees
Staking participation
These metrics offer insight into how a network is being used, not just how it’s being traded.
Key Indicators Every Beginner Should Watch
Instead of tracking dozens of metrics, focus on these:
1. Bitcoin Dominance
Shows Bitcoin’s share of the total crypto market.
Increasing dominance often signals investors favoring Bitcoin over smaller cryptocurrencies.
2. Fear & Greed Index
Measures overall market sentiment. Extreme fear can coincide with periods when prices are depressed. Extreme greed can indicate excessive optimism. It is a sentiment indicator, not a prediction tool.
3. Stablecoin Supply
Growth in stablecoin supply may indicate more capital is available to enter crypto markets, though it does not guarantee that those funds will be invested immediately.
4. Exchange Inflows and Outflows
Coins moving onto exchanges may increase potential selling pressure.
Coins leaving exchanges may reduce immediately available supply.
Always interpret these flows alongside broader market conditions.
Beginner Mistakes When Reading Market Data
Avoid these common traps:
Looking only at price
Ignoring trading volume
Buying because of social media hype
Assuming one indicator predicts the future
Trading emotionally
Forgetting risk management
Ignoring macroeconomic news
The market rewards patience more often than speed.
Step-by-Step: Analyze a Cryptocurrency in 10 Minutes
Use this simple app and routine whenever you research a coin.
Step 1
Check the current trend.
Step 2
Review trading volume.
Step 3
Compare market capitalization.
Step 4
Look at recent news.
Step 5
Study support and resistance.
Step 6
Review on-chain metrics if available.
Step 7
Ask:
Is adoption growing?
Is liquidity healthy?
Does the data support the current price?
Only then should you consider making an investment decision.
Key Takeaways
Understanding crypto market data is about building a complete picture instead of reacting to headlines.
Benefits
Better-informed investment decisions
Reduced emotional trading
Stronger risk management
Greater confidence when reading charts
Improved ability to identify long-term trends
Risks
No indicator guarantees future price movements.
Markets can react unexpectedly to breaking news, regulatory changes, or security incidents.
Data should always be interpreted in context rather than in isolation.
Real-World Applications
Evaluate whether a market rally has broad participation by checking volume.
Compare projects using market capitalization rather than price alone.
Use support and resistance levels to plan entries and exits.
Combine on-chain activity with chart analysis to strengthen your research.
The best investors don’t predict the future, they improve the quality of their decisions by using reliable information and all these information are available on XanteApp
Conclusion
Every cryptocurrency price tells a story, but price alone is only the first chapter. When you combine charts, volume, market capitalization, liquidity, order books, and on-chain activity, you begin to understand the forces driving the market rather than simply reacting to them.
You won’t predict every market move and no one can. What you can do is make decisions based on evidence instead of emotion. Start small. Practice consistently. Review the same metrics every day. Over time, the numbers that once seemed confusing will begin to reveal clear patterns and insights.
Pick one cryptocurrency, such as Bitcoin or Ethereum and spend the next seven days tracking its price, trading volume, market capitalization, and one on-chain metric. Keep a simple journal of what you observe and compare your notes with major news events.
As your confidence grows, expand your analysis to other assets and timeframes. The habits you build today will serve you far better than chasing the latest viral prediction.
The crypto market never stops learning and neither should you.
For more guide like this, follow us on all our social media platforms.